Show how the micro code generated from the target machine's instructions are translated into the appropriate instruction set for the host machine.
Background:
When Qemu is running a target machine, each individual instruction is translated into a series of micro code instructions that will carry out the same functionality of the original instruction. This series of micro code instructions is then translated into the corresponding instructions of the host machine.
Procedure:
1. Once again, lets run Qemu through gdb
- Set breakpoint at disas_insn (b disas_insn) and press <ENTER>
- Type: "handle SIGUSR1 noprint" and press <ENTER>
- Type: "shell" and press <ENTER>
- Type: "vim run.sh", press <ENTER> and copy all the text from -m to end of file then exit vim
- exit shell (Type: "exit" and then press <ENTER>)
- Run the emulator (Type: "r " then paste the content you copied and press <ENTER>)
You should now have hit the breakpoint you set at the disas_insn function
2. Skip the first 100 or so times the breakpoint at disas_insn is hit
- Type (then press <ENTER>):
- ignore 1 100
- c
 |
| What you should be seeing at this point |
3. Lets view the current instructions to be executed by the target machine
 |
| NOTE: the print_instrRange function is not a built in Qemu method, but something we added for debugging purposes |
4. Now lets view the micro code buffer before jz is translated

REMEMBER: tcg_ctx.gen_opc_ptr is the global variable that gives us the current location in the buffer containing the micro code
NOTE: The buffer does not clear itself after an instruction is translated to micro code. What is important to notice now is not the current content, but how the content at the specified address (0x28c2be46) changes when the instruction is being translated.
5. Lets place a hardware read watchpoint at that address (0x28c2be46) so that we can determine what part of the Qemu code is actually using the content inside this buffer
- Type: "rwatch *0x28c2be46" then press <ENTER>
rwatch is the gdb command to set a watchpoint (breakpoint) that will notify us when a piece of code tries to read from the specified location in memory (0x28c2be46)

By placing this hardware read watchpoint, gdb will freeze the execution so that we can see what code is trying to access that memory. From there, we will be able to step into it and try to search for the buffer containing the instructions generated from the translated micro code for use by the host machine.
6. Type "c" to continue the execution and lets observe when it hits one of our breakpoints

From the output of our hardware read watchpoint, we can see the line of code that is trying to access the specified memory address (0x28c2be46)
7. Lets see what file this line of code belongs to. To do that, we are going to use the backtrace function of gdb (bt)

The piece of code reading that memory address belongs to the tcg.c file. Lets continue debugging from this point.
8. Go to the next instruction, list, the contents, and print the value of opc (the variable that read the content from address 0x28c2be46)

We can see that the current micro code being translated is INDEX_op_mov_i32 (we can print the hex value of this which is 0xa which is equal to decimal 10 which corresponds to its location in tcg-opc.g file). Lets continue to go to the next instruction until we see something that may pertain to translating micro code into host machine instructions.
9. Go to the next instruction 3 times and then you should see a function called tcg_reg_alloc_mov

This function seems like it may have something to do with the translation process so lets step into it.
10. Now that we are in the tag_reg_alloc_mov method, lets list its contents and step through it until we see something of interest.
Go to the next instruction 10 times and then we will see a function that appears it may have more to do with the translation process.

Notice the parameters being passed to the function. It appears that this function might be altering register values. Lets step into and see what may be happening.
11. Step into the function tcg_out_ld, then go to the next instruction 2 times

Here we see a function that is taking an opcode (opc) as a parameters. Lets see how this parameter is being used so lets step into this function now.
12. Step into this function (tcg_out_modrm_offset) and continue going to the next line until something of interests shows up (n 1 time)

Another function taking the opcode as a parameter is called. Lets step into this function now.
13. Step into tcg_out_modrm_sib_offset and go to the next line until we see something interesting again.

After pressing next 7 times, we see another function taking the opcode as a parameters. As we have done before, lets step into it and view its contents.
14. Press next 3 times and we will see another function taking the opcode as a parameters.

As we have done previously, lets step into this function and see what it does with the opcode. Take note of the opcode being passed to the function (139).
15. Step into tag_out8 and go to the next line 1 time
Finally, the value of the opcode is being assigned to something. Let us see what variable, s, refers to:
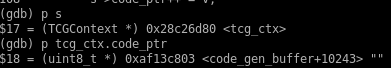
Variable s refers to the global variable we used previously to view the micro code buffer, tcg_ctx. By printing out the address of code_ptr, we can examine the contents of the buffer its points to.
16. Display 15 instructions from the address of tcg_ctx.code_ptr using gdb's x command

It appears that the buffer at this location has not been populated by any translated micro code instructions yet. Let us verify this by displaying its contents.
17. Display the contents of address 0xaf13c803
Our hypothesis of the buffer being empty is indeed correct. Lets continue the programs execution and see how this changes.
18. Press "c" to allow the program to continue executing until it hits our watchpoint again

The address of tcg_ctx.code_ptr has changed. Lets see if its contents have also changed.
19. Display the contents of tcg_ctx.code_ptr from the original address again using the x command
The buffer has indeed changed. It is no longer fully zeroed out. Lets see if any translated micro code instructions were generated.
20. Display 15 instructions from the original address of tcg_ctx.code_ptr (0xaf13c803)

Two instructions to be used by the host machine were generated from the micro code! If you let it continue again, you will see that more instructions have been translated.
Summary:
Instructions for the target machine are translated into a series of micro code instructions. Those micro code instructions are then translated into a series of host machine instructions by extracting the micro code from the tcg_ctx.gen_opc_ptr buffer in the tcg_gen_code_common function of tcg.c. From there, the opcode is passed through several other functions which translates the micro code opcode into the host machine op code and places it in a buffer.
No comments:
Post a Comment