Saturday, May 24, 2014

Exploration of Windows CPU Scheduling Algorithm by Kernel Debugging using WinDBG


Background:

When an OS snapshot is loaded into the Qemu emulator for analysis, it takes an increasing amount of time for the snapshot to load based on how long ago it is taken. In order to fix this problem within Qemu, it is vital to understand how the Windows XP kernel handles process scheduling and timer interrupts.

Purpose:

To understand the Windows kernel code for process scheduling and handling timer interrupts.

Steps:


1. Start WinDBG on your machine and start kernel debug (File --> Kernel Debug --> OK)

Make sure your COM settings match those in the picture

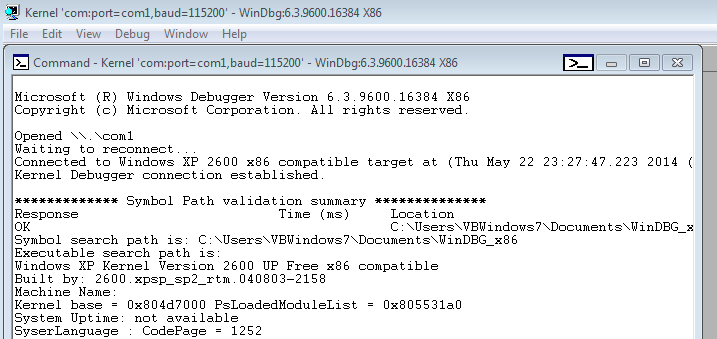
2. Start your Windows XP virtual machine and WinDBG should display something similar to the following picture

******************
NOTE: If you see something similar to the below picture, follow these steps from Microsoft:


Using the Microsoft Symbol Server with WinDbg

To use the Symbol Server Web site from within WinDbg, follow these steps:
  1. Start the Windows Debugger (WinDbg.exe).
  2. On the File menu, click Symbol File Path.
  3. In the Symbol path box, type the following command:
    SRV*your local folder for symbols*http://msdl.microsoft.com/download/symbols
    where your local folder for symbols is the folder in which you copy your local symbol cache. The debug symbols are downloaded to this location.

    Note You can point to any local path or share that your computer can reach; it does not have to be a location on the computer's hard disk.
Alternatively, you can also use the .sympath command at a command prompt to set the symbol path.
After the symbols are downloaded, each time after you use WinDBG you will need to click on File --> Symbol File Path then paste (or browse) the path where the symbols were downloaded to and press OK before you start to debug your Windows virtual machine

******************


3. Lets send an interrupt to the target machine (Windows XP virtual machine) so that we will be able to analyze some of the current system conditions (Debug --> Break)


And WinDBG should display something similar to the following:

The box circled in yellow is where we can input WinDBG commands

4. Type the WinDBG command "!idt -a" which will display all the interrupts


5. Once all the interrupts are displayed, lets search for one that may handle any timer interrupts

HalpClockInterrupt handles timer interrupts and process scheduling

6. Now that we have seen what interrupts are currently active on the system and found the one related to timer interrupts, let us review the C code for it.

We are going to use ReactOS to look at the code for HalpClockInterrupt. This is an open source site that has code derived from the Windows NT architecture.


As you can see, the code for HalpClockInterrupt clears the interrupt, and updates the kernel's system time. Lets take a closer look at each line of the function:

NOTE: if you go to the site yourself, you will be able to click on the links to see where certain functions/macros are defined and given values

Line 1 (33): ASSERT(KeGetCurrentIrql() == CLOCK2_LEVEL);


  • CLOCK2_LEVEL:
    • Defined: armddk.h
    • Type: Macro
    • Value: 28
    •  Meaning: Not known at this time
  • KeGetCurrentIrql():
    • Defined: keytypes.h
    • Type: Macro (function)
    • Value: PCR->Irql
    • Functionality:
      • Gets the current Irql (Interrupt ReQuest Level) for the kernel
      • PCR (process control region) is a macro that contains an address (KIPOPCRADDRESS = 0xffdff000)
      • Irql is of type PKIRQL which is a pointer to an unsigned char which helps specify a kernel type
      • PCR->Irql gets the interrupt request level of the current process
  • ASSERT():
    • Defined: mode.c
    • Type: Macro (function)
    • Parameter: an unsigned char type defined as a GLboolean
    • Functionality:
      • Gets the value of the result from the passed in conditional statement
  •  Line Summary:
    • Used to help clear the interrupt and gives ASSERT a value based on the above conditional statement

Line 2 (34): WRITE_REGISTER_ULONG(TIMER0_INT_CLEAR, 1);

  • TIMER0_INT_CLEAR:
    • Defined: sp804.h
    • Type: Macro
    • Value: TIMER_BASE(0) + 0x0C
    • Meaning:
      • Sets (clears) the clock value by passing a 0 to TIMER_BASE and then adds 0x0C (12) to the result of TIMER_BASE which is an address (0x101E2000)
  • WRITE_REGISTER_ULONG(r, v):
    • Defined: bootvid.c
    • Type: Macro (function)
    • Parameters: GLboolean r, GLboolean v
    • Functionality:
      • Sets the value of r equal to value of v (1)
  • Line Summary:
    • Used to help clear the interrupt and set the value of a register
·    

Line 3 (41): KeUpdateSystemTime(KeGetCurrentThread()->TrapFrame, HalpCurrentTimeIncrement,CLOCK2_LEVEL);

  • KeGetCurrentThread()->TrapFrame:
    • Defined: hal.h
    • Type: Macro
    • Value: _KeGetCurrentThread (macro function that grabs the current thread)
    • Meaning:
      • Obtains the thread currently being executed and its associated trap frame
  • HalpCurrentTimeIncrement:
    • Defined: timer.c
    • Type: ULONG (variable)
    • Value:  Not known at this time
    • Meaning: Not known at this time
  • CLOCK2_LEVEL:
    • Defined: armddk.h
    • Type: Macro
    • Value: 28
    • Meaning: Not known at this time
  • KeUpdateSystemTime():
    • Defined: time.c
    • Type: Function
    • Parameters: trap frame (PKTRAP_FRAME), Increment (ULONG), OldIrql (KIRQL)
    • Functionality:
      • Updates the system time
      • Checks to see if the current tick is being skipped and if so marks it so that it gets handled next time
      • Updates the interrupt timer and global time keeping data
      • Checks to see if the timer expired
      • Updates all tick data if the current tick is a full tick and less than or equal o the old tick
  • KeUpdateRunTime(IN PKTRAP_FRAME TrapFrame, IN KIRQL Irql)
    • Called within KeUpdateSystemTime()
    • Defined: time.c
    • Type: Function
    • Parameters: PKTRAP_FRAME, KIRQL
    • Functionality:
      • Obtains the current running thread and PRCB (process region control block) 
        • The PRCB is a struct that contains information about the processor
      • Checks if the processor is skipping this current tick
        •  If the tick is being skipped, the function will return
      • Increases the interrupt count
      • Checks to see if the process is in user mode or kernel mode
        • If the process came from user mode, it increases the process’s user time which increments how much time the current process has spent in user mode
        • If the process did not come from user mode (it came from kernel mode)
          • Increments the amount of time it spent in kernel mode
          • Increments the process’s interrupt time, kernel time, or DPC time (the amount of time the process has been on the Deferred Procedure Call queue) based on the value of DISPATCH_LEVEL (which is a macro defined in ksx.template.h) when being compared to the passed in value for IRQL
            • DPC is part of the Windows OS that allows high priority tasks to defer lower priority, but still required, tasks for later execution
      • Updates the DPC rates
      • Checks to see if the DPC queue is large enough
        • Adjusts the maximum depth of the DPC queue
      • Decrements the thread quantum (Thread->Quantum)
        • Thread Quantum is a global variable that keeps track of how long the current process has left before the CPU jumps to the next process
        • When the thread quantum reaches 0, the CPU has to perform a context switch to another process
      • Checks to see if a context switch needs to occur
        • If a context switch occurs:
          • Sets the value of Prcb->QuantumEnd to 1 (true)
          • Calls the function HalRequestSoftwareInterrupt and passes the DISPATCH_LEVEL to it
  • HalRequestSoftwareInterrupt(KIRQL Irql)
    • Called within KeUpdateRunTime()
    • Defined: pic.c
    • Type: Function
    • Parameters: KIRQL (the interrupt request level)
    • Functionality:
      • forces a software interrupt by overwriting the value of a register
  • Line Summary:
    • Obtains the current process and updates the internal structures in order to trigger a context switch

Summary:

The HalpClockInterrupt function updates the systems kernel level clock and clears previous interrupts and registers. It also alerts the CPU to when a context switch needs to occur based on the value of the process's thread quantum. Once the quantum is given a value of 0, a context switch occurs and the CPU will execute a different process. 

Total Hours: 8

Thursday, May 1, 2014

Anatomy of Qemu Dynamic Translation Using GDB Part 2

Purpose:

Show how the micro code generated from the target machine's instructions are translated into the appropriate instruction set for the host machine.

Background:

When Qemu is running a target machine, each individual instruction is translated into a series of micro code instructions that will carry out the same functionality of the original instruction. This series of micro code instructions is then translated into the corresponding instructions of the host machine.

Procedure:

1. Once again, lets run Qemu through gdb

  • Set breakpoint at disas_insn (b disas_insn) and press <ENTER>
  • Type: "handle SIGUSR1 noprint" and press <ENTER>
  • Type: "shell" and press <ENTER>
  • Type: "vim run.sh", press <ENTER> and copy all the text from -m to end of file then exit vim
  • exit shell (Type: "exit" and then press <ENTER>)
  • Run the emulator (Type: "r " then paste the content you copied and press <ENTER>)
You should now have hit the breakpoint you set at the disas_insn function

2. Skip the first 100 or so times the breakpoint at disas_insn is hit

  • Type (then press <ENTER>):
    • ignore 1 100
    • c
What you should be seeing at this point

3. Lets view the current instructions to be executed by the target machine

NOTE: the print_instrRange function is not a built in Qemu method, but something we added for debugging purposes
The x86 instruction, jz, is the current instruction to be translated by Qemu

4. Now lets view the micro code buffer before jz is translated


REMEMBER: tcg_ctx.gen_opc_ptr is the global variable that gives us the current location in the buffer containing the micro code

NOTE: The buffer does not clear itself after an instruction is translated to micro code. What is important to notice now is not the current content, but how the content at the specified address (0x28c2be46) changes when the instruction is being translated.

5. Lets place a hardware read watchpoint at that address (0x28c2be46) so that we can determine what part of the Qemu code is actually using the content inside this buffer

  • Type: "rwatch *0x28c2be46" then press <ENTER>
rwatch is the gdb command to set a watchpoint (breakpoint) that will notify us when a piece of code tries to read from the specified location in memory (0x28c2be46)


By placing this hardware read watchpoint, gdb will freeze the execution so that we can see what code is trying to access that memory. From there, we will be able to step into it and try to search for the buffer containing the instructions generated from the translated micro code for use by the host machine. 

6. Type "c" to continue the execution and lets observe when it hits one of our breakpoints


From the output of our hardware read watchpoint, we can see the line of code that is trying to access the specified memory address (0x28c2be46)


7. Lets see what file this line of code belongs to. To do that, we are going to use the backtrace function of gdb (bt)


The piece of code reading that memory address belongs to the tcg.c file. Lets continue debugging from this point.

8. Go to the next instruction, list, the contents, and print the value of opc (the variable that read the content from address 0x28c2be46)


We can see that the current micro code being translated is INDEX_op_mov_i32 (we can print the hex value of this which is 0xa which is equal to decimal 10 which corresponds to its location in tcg-opc.g file). Lets continue to go to the next instruction until we see something that may pertain to translating micro code into host machine instructions.

9. Go to the next instruction 3 times and then you should see a function called tcg_reg_alloc_mov


This function seems like it may have something to do with the translation process so lets step into it.


10. Now that we are in the tag_reg_alloc_mov method, lets list its contents and step through it until we see something of interest.

Go to the next instruction 10 times and then we will see a function that appears it may have more to do with the translation process.


Notice the parameters being passed to the function. It appears that this function might be altering register values. Lets step into and see what may be happening.

11. Step into the function tcg_out_ld, then go to the next instruction 2 times


Here we see a function that is taking an opcode (opc) as a parameters. Lets see how this parameter is being used so lets step into this function now.

12. Step into this function (tcg_out_modrm_offset) and continue going to the next line until something of interests shows up (n 1 time)


Another function taking the opcode as a parameter is called. Lets step into this function now.

13. Step into tcg_out_modrm_sib_offset and go to the next line until we see something interesting again.


After pressing next 7 times, we see another function taking the opcode as a parameters. As we have done before, lets step into it and view its contents.

14. Press next 3 times and we will see another function taking the opcode as a parameters.


As we have done previously, lets step into this function and see what it does with the opcode. Take note of the opcode being passed to the function (139).

15. Step into tag_out8 and go to the next line 1 time


Finally, the value of the opcode is being assigned to something. Let us see what variable, s, refers to:


Variable s refers to the global variable we used previously to view the micro code buffer, tcg_ctx. By printing out the address of code_ptr, we can examine the contents of the buffer its points to.

16. Display 15 instructions from the address of tcg_ctx.code_ptr using gdb's x command


It appears that the buffer at this location has not been populated by any translated micro code instructions yet. Let us verify this by displaying its contents.

17. Display the contents of address 0xaf13c803


Our hypothesis of the buffer being empty is indeed correct. Lets continue the programs execution and see how this changes.

18. Press "c" to allow the program to continue executing until it hits our watchpoint again


The address of tcg_ctx.code_ptr has changed. Lets see if its contents have also changed.

19. Display the contents of tcg_ctx.code_ptr from the original address again using the x command


The buffer has indeed changed. It is no longer fully zeroed out. Lets see if any translated micro code instructions were generated.

20. Display 15 instructions from the original address of tcg_ctx.code_ptr (0xaf13c803)


Two instructions to be used by the host machine were generated from the micro code! If you let it continue again,  you will see that more instructions have been translated.

Summary:

Instructions for the target machine are translated into a series of micro code instructions. Those micro code instructions are then translated into a series of host machine instructions by extracting the micro code from the tcg_ctx.gen_opc_ptr buffer in the tcg_gen_code_common function of tcg.c. From there, the opcode is passed through several other functions which translates the micro code opcode into the host machine op code and places it in a buffer.