Sunday, October 5, 2014

Exploration of Interrupt Handling of QEMU

Purpose:

This article reviews how an interrupt is handled by Qemu.

Background:

My conjecture is that do_interrupt is called whenever an interrupt needs to be passed to the guest OS. By analyzing do_interrupt, we will be able to view who is triggering the interrupt and what part of the code is handling the interrupt.

Steps:

1. Debug into Qemu and set a breakpoint at do_interrupt. 


This is what the do_interrupt code looks like (target-i386/seg_helper.c)


2. Step over each line until you hit do_interrupt_all. Step into do_interrupt_all.

NOTE: you may have to repeat the step command several times because the parameter list of the function spreads over several lines


It is important to notice the interrupt number (intno) in the parameter list. The interrupt number will allow us to see exactly what interrupt is causing the call to do_interrupt


Interrupt 14 is a page fault.

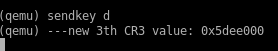
3. Now, lets see who is generating this interrupt. We will do this by viewing the EIP maintained by Qemu.


This address is wrong because the memory of the guest OS is not directly loaded into the memory of the host machine. To find the address true value of EIP, we will have to set a breakpoint in helper_trace2  so that we can view the actual code that is triggering the interrupt.


Above is the address of the assembly code causing the interrupt. Now we can view the actual assembly by using a function added to the Qemu system.


Now that we know what part of the assembly code is generating the interrupt, we now need to determine what part of the assembly code is handling the interrupt.

4. We need to find a piece of Qemu code that is emulating the guest's Interrupt Descriptor Table. This table contains a mapping for each interrupt that tells it where to jump to. Continue stepping through do_interrupt_all until you hit another version of do_interrupt. In our case, it will be do_interrupt_protected. Step into it.


Soon after you step into it, GDB hits a line that pertains to the interrupt descriptor table.


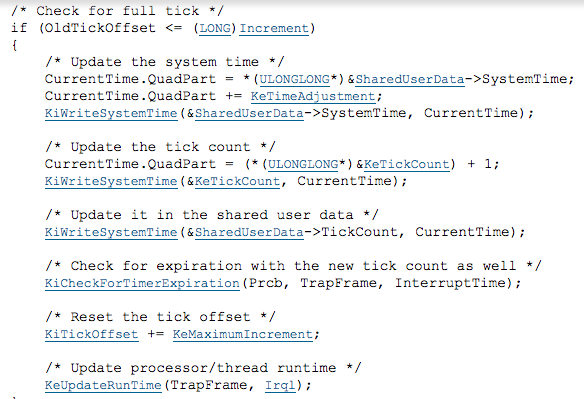
The following two lines of code are important to how the address of the handler is found.


Every entry in the interrupt descriptor table is 2 bytes. Line 607 uses the interrupt number as an index along with some offset to determine where in the table to go. ptr on line 610 will point to the corresponding entry for the interrupt. We cannot use ptr to read the guest OS's memory because it is pointing to virtual memory. First, we must step through the code some more because the remaining code will use the information in the interrupt descriptor table to determine to next address of EIP. We will extract the handler's address by viewing the EIP once it is updated.


5. Step through do_interrupt_protected until env->eip receives a new value.


The value of offset will be the address of the handler of the interrupt.


6. Once again, let's view the associated assembly.


Summary:

The CPU will now jump to the handler code and proceed with carrying out the interrupt. 


Saturday, August 2, 2014

A QEMU BUG: No Context Switch on a Stale Snapshot

Background

Depending on the age of a snapshot taken with Qemu, its behavior could vastly vary from running perfectly normally to exhibiting behavior that appears the OS is frozen. This is a result of a bug in the Qemu system. My conjecture is that the bug is related to the way in which Qemu handles the timers for the guest OS.

Purpose

To prove that there is a bug in Qemu that prevents older snapshots from running properly, we inserted a function into the Qemu system, helper_trace2, that executes before every single instruction is run through the Qemu emulated CPU. By inserting this function into ops_sse.h, it allows us to verify that the Qemu system is in fact not performing a context switch. We will be able to see that a context switch occurred because the function prints out, "new xth CR3 value".  This message will only be generated for new processes. CR3 (Control Register #3) is a special register in Intel's CPUs. This register is used for keeping track of the beginning address of a page table for the current process. It can also act as a unique identifier for a process. 

Procedure

1. First, I will demonstrate the output of helper_trace2 by debugging into Qemu using GDB

Once Qemu begins to run, the message is printed out immediately


The part of helper_trace2 that prints out that message looks like this:


2. Now, I will let Qemu load the guest Windows XP system normally to demonstrate that the message is printed out with each new process generated by the guest OS


For each new process, helper_trace2 prints out the page table address for that particular process. Now if we were to run an older snapshot, the "xth CR3" value would never be printed indicating that a context switch is not being performed. 

3. I'm going to demonstrate that when an old snapshot is loaded into Qemu, only one statement from helper_trace2 will be printed.

First, I load the old snapshot and then send key press events to the guest OS.


As shown in the above picture, a second CR3 value was obtained, but not matter how long I wait or event I send, a new process is never switched to. This can also be observed by viewing the Qemu window displaying the guest OS. They "d" key is not present in the command window nor is the cursor blinking.


Conclusion

Since no new CR3 values are found, we can conclude that no new processes are being created and therefore, the Qemu CPU is not performing a context switch. This is a bug in the Qemu system that we will fix in the future.


Sunday, July 27, 2014

Debug the Loading Delay Problem of Qemu

Background:

In the last post, we analyzed the Windows's kernel assembly instructions corresponding to timer interrupts and CPU context switches. Since we have a better understanding of what occurs at the kernel level, it is time to observe the loading delay problem encountered in Qemu when loading older snapshots of Windows XP. When a snapshot is loaded in Qemu, it may work as it is meant to, not load at all, or become unstable and slow due to a problem with the way in which Qemu handles timer interrupts. 

Purpose:

Demonstrate the aforementioned problem and show the reason for Qemu's unstable behavior.

Steps:

1. Start by booting up the Linux vm that has Qemu installed and start Qemu using "sudo gdb qemu-system-i386"


2. Let's grab the run parameters for Qemu that are stored in run.sh


Then copy all the parameters from the "-m"


3. Exit vim, and the shell and paste the parameters after the run command in gdb


4. If the process crashes, we have to then type "handle SIGUSR1 noprint" and re-run Qemu


Then,


5. Now you can see that Qemu has started


6. Snapshots for the Windows XP image were taken previously and now we are going to analyze what happens when these snapshots are loaded and take note of how the system behaves. First, let's list the snapshots available and load one of them.


When I tried to load the snapshot named "snap111", Qemu crashed because the snapshot is too old.


7. Now re-run Qemu and I am going to try snap222


This time, the snapshot loads properly and it is displayed in the Qemu window


8. Now we are going to see if the snapshot is behaving as it should by sending it key commands through Qemu.

The first command I am going to send is the "sendkey d" command and it should print "d" in the command prompt.

Qemu command

Snapshot

Unfortunately, the command was not properly received by the snapshot because the timer that controls the context switch of the CPU is not working correctly. Let us try this experiment on a snapshot that was taken more recently.

9. Quit that Qemu session and re-run Qemu again.

10. Creating a new snapshot should minimize the impact of the bug in Qemu's APIC timer and allow the sendkey command to work for a period of time.


As you can see, a new snapshot has been created.

11. Let's load the snapshot and try the sendkey command again.


12. Even with a new snapshot, the command is not properly sent to the vm, because the behavior of the bug in the APIC timer and the context switch is sort of random.

Conclusion:

As you can see, there is a problem in the way Qemu handles snapshots. The behavior is unpredictable and makes the snapshot unusable. In addition to the sendkey command not working properly, it is worth taking note that the command prompt on the Windows vm does not display the blinking cursor as you would expect. This is also a result of the bug in the way Qemu handles the APIC timer.


Sunday, July 13, 2014

Using WinDBG to Explore Round Robin Thread Context Switch for Win32 Kernel

Background:

We explored the ReactOS code for HalpClockInterrupt to get an idea of what may be involved when the kernel handles process scheduling and timer interrupts.  Now that we know the general framework of the scheduling algorithm, we are going to debug into the actual Windows XP kernel using WinDBG to view the assembly code for it and draw parallels between the assembly and the ReactOS code.

Purpose:

The purpose of this article is to more closely analyze the round robing context switch algorithm of the Win32 kernel code and determine what the initial quantum value given for a thread is. The value of a thread's quantum indicates how long the thread will run before a context switch occurs and a new thread gets scheduled.

Steps:

1. Boot up WinDBG in kernel debug mode and the Windows XP image to debug

2. Get the address of HalpClockInterrupt (!idt -a)


3. Set a hardware breakpoint at the address (ba e1 806d4d50) then continue execution until the breakpoint is hit (NOTE: your address may differ)


Command breakdown: 
b - set a breakpoint
a - hardware break point
e1 - when one byte of the address is executed

4. Now we will step through the assembly of HalpClockInterrupt as well as some of the other functions called from it while comparing the assembly to the ReactOS code


The code in the above picture creates a new stack frame for HalpClockInterrupt

5. 


Corresponds to the following code from ReactOS


6.  There is plenty of assembly code that does not seem to correspond to any code listed in ReactOS's implementation of HalpClockInterrupt. For now, we will bypass this assembly.

7. Now we can see that KeUpdateSystemTime is called from HalpClockInterrupt with its corresponding parameters.
HalpClockInterrupt

Corresponding assembly

8. The following ReactOS code checks to see if the timer has expired by comparing it to the one stored in KiTimerTableListHead which is a struct

HalpClockInterrupt

KiCheckForTimerExpiration

Corresponding assembly

9. Now the kernel code is checking to see if the debugger is enabled

KeUpdateSystemTime

In this case, the assembly does not go into the body of the if statement.

corresponding assembly

10. The next chunk of assembly skips into the end of an if body in KeUpdateSystemTime, but the main part to look at is the call to KeUpdateRunTime. This is where the quantum value of a thread is read and a context switch occurs.

KeUpdateSystemTime

Corresponding assembly code (partially)

11. Let us explore KeUpdateRunTime.

Corresponding assembly when KeUPdateRunTime is called

12. After stepping through various lines of assembly, we will come across a section that appears to resemble a piece of the KeUpdateRunTime code that is trying to determine if the thread is in an ISR. An ISR is an interrupt service routine, which is responsible for doing whatever is necessary to stop an interrupt.

KeUpdateRunTime
Assembly code

13. Following that, ReactOS code checks to see if the DPC queue is large enough. DPC (deferred procedure call) is an OS mechanism that permits high priority tasks to run ahead of low priority, but required tasks. Each deferred task is appended to a queue to be run later. In the case of the ReactOS code, it checks to see if the queue has become too large and if so, executed one of the deferred tasks.

KeUpdateRunTime

Associated assembly

14. After several more step throughs, we come across an assembly line that subtracts 3 from an offset of EBX.  I believe this memory address to be the quantum of the thread based off the code in ReactOS. When the quantum reaches 0, it will perform a context switch and a new thread will be executed.

assembly


KeUpdateRunTIme

15. If you click CLOCK_QUANTUM_DECREMENT, you will come across a file called types.c that has the following definition.


CLOCK_QUANTUM_DECREMENT is defined to have a value of 3 which corresponds to the value subtracted from that particular memory address in the previous step. The max quantum of a thread is set to 0x7F which is 127. Since, a thread has a max quantum of 127 and has 3 subtracted from it for every other tick, (127/3)*2 = 84 which is how many ticks a thread runs for.

16. Now lets find the frequency of the clock. It has the possibility of being one of two clocks, APIC or PIC. If you do a quick Google search, you may come across this page. The description of APIC Periodic Mode,  is very similar to the code we have seen in ReactOS and the corresponding assembly where the timer keeps a count and decrements it until it reaches 0. When it reaches 0, it performs a context switch and reinitializes the count.

17. HalpInitializeClock is a ReactOS function in timer.c. From this file we can see that timer frequency is 1 MHz with an interval of 10 milliseconds.

timer.c

Conclusion:

We discovered what the max quantum of a thread is (127) and each thread is allocated 84 ticks. The frequency of the APIC timer is 1 MHz so the total run time for a thread is 84/10000 = 0.0084 seconds = 8.4 milliseconds per thread.

Total Time: 10 hours